
Summary
This page expands on the results published in the paper: Campbell Ian, 2007, Chi-squared and Fisher-Irwin tests of two-by-two tables with small sample recommendations, Statistics in Medicine, 26, 3661 - 3675.
Comparative trials
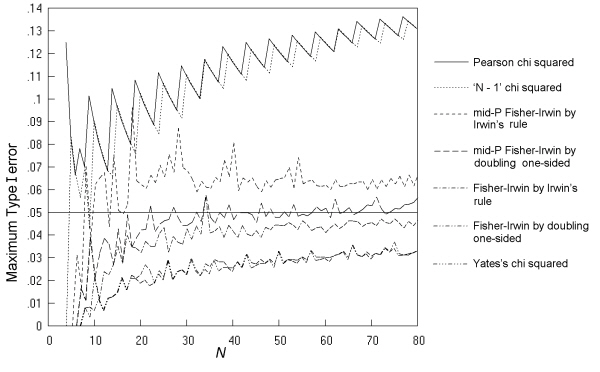
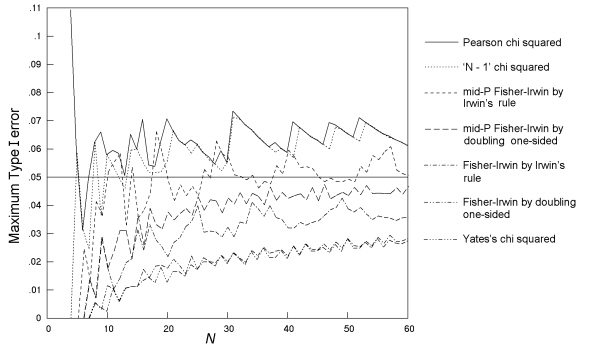
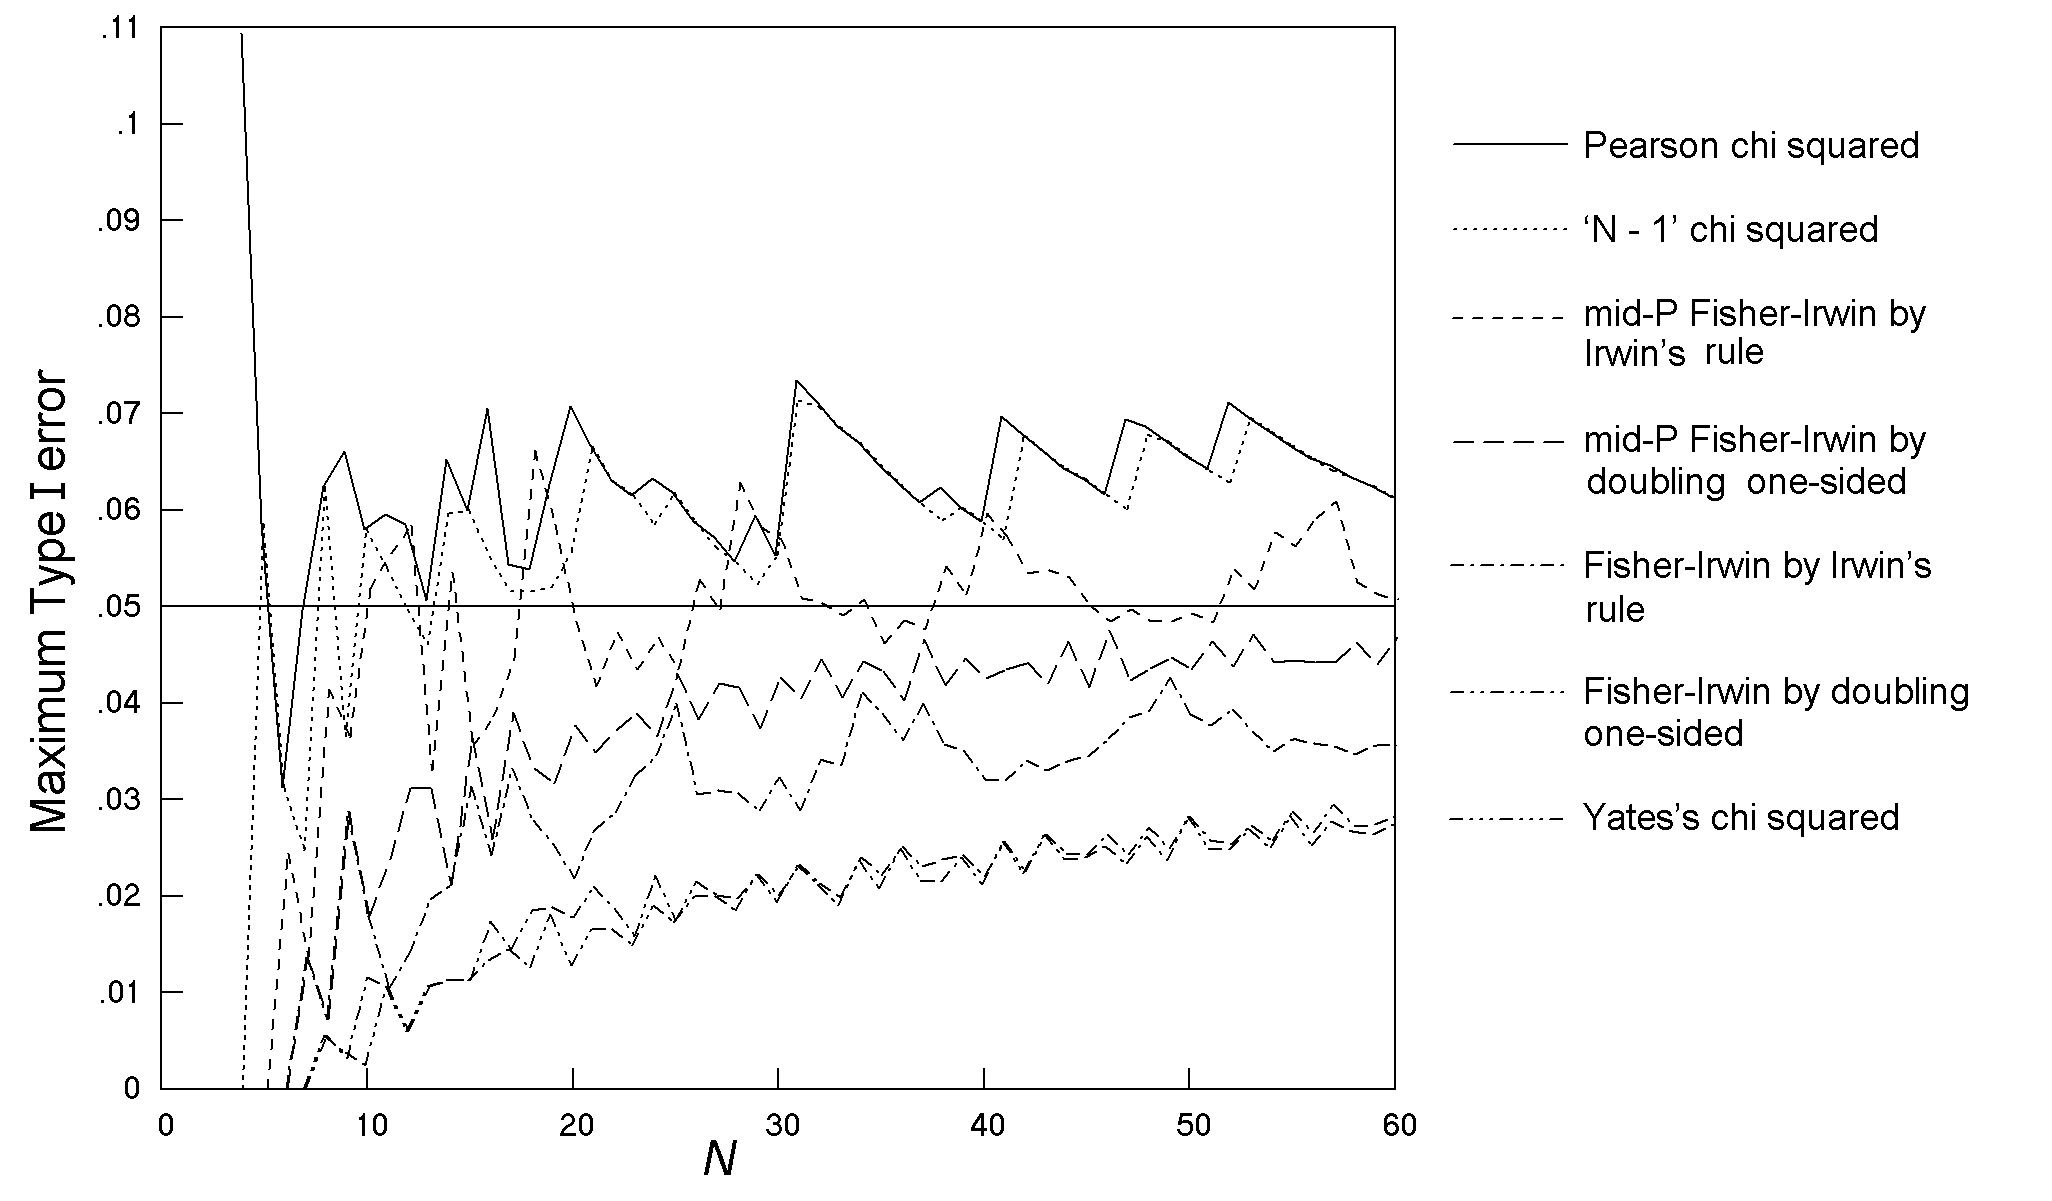
Fig. 5 gives the maximum Type I error across all values of π and all possible m, n pairs at a nominal α of 0.05 for the seven two-sided tests, as a function of N. The findings replicate those of previous studies, with rates considerably higher than the nominal for the K. Pearson and 'N - 1' chi squared tests. The mid-P Fisher-Irwin test by Irwin's rule also has rates that are too high, but to a lesser degree. Of the remaining four tests studied, the mid-P Fisher-Irwin test by doubling the one-sided value performs closest to the nominal, with a good match at N over 30. As in previous studies, Yates's chi squared and the standard Fisher-Irwin tests have rates much lower than the nominal 0.05.
Full sized version
Coloured version
Fig. 5. Comparative trials: the maximum Type I error over all values of π and all possible m, n pairs at a nominal α of 0.05 for seven tests, with an inaccuracy of less than 0.001.
Further investigations confirmed the findings of previous studies that the high rates for the K. Pearson and 'N - 1' chi squared tests occur at unequal sample sizes and low values of π. For example, Fig. 6 (solid line) replicates part of Fig. 5(a) of Upton's 1982 paper, studying a comparative trial with N = 30, m = 6, and n = 24, and shows a peak Type I error rate of 9.05% at π = 0.045. It is worth investigating which sample tables occur most often at this peak; and out of the 74 different tables significant at 5%, the table (1 5 0 24) (together with variants by symmetry) occurs at a rate of 7.0%, the table (2 4 1 23) (and variants) occurs at 1.0%, the table (2 4 0 24) (and variants) occurs at 0.8%, and the other 71 significant tables occur at a combined rate of just 0.2%. So the non-ideal behaviour of the chi squared test in this situation is due to the inclusion in the set of significant outcomes of a table that compares 1 out of 6 successes with 0 out of 24 - an outcome that common sense tells us we should not view as conclusive evidence as it depends upon a single observation.
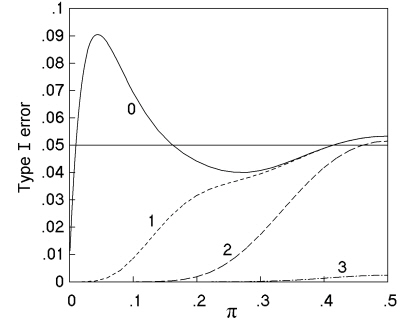
Fig. 6. Variation in Type I error rate with population proportion (π) at α = 0.05 for a comparative trial with N = 30, m = 6, and n = 24, analysed by K. Pearson's chi squared test. The four lines compare no restriction of the test (----) with restriction to sample tables with expected numbers of at least 1 (- - -), 2 (-- --), and 3 (-- - --).
Policies based on a minimum marginal total
The finding in the above example that the imperfect behaviour of the K. Pearson chi squared test depends on the table (1 5 0 24), that has a marginal total of 1, suggests that one or more of the three tests with Type I error rates well above the nominal could be made a better match to the ideal by restricting use to tables where all marginal totals are equal to or greater than a certain minimum such as 2. However, data generated in this study restricting use to tables with minimum marginal totals ranging from 2 to 6 did not support any consistent policy for any of the tests that would produce Type I error rates close to the nominal over ranges of values of N and α. The charts demonstrating this are not shown to save space, but like other charts, they can be generated by interested readers after downloading the freely available software.
Policies based on a minimum expected number
The smallest expected numbers for the three tables, (1 5 0 24), (2 4 1 23) and (2 4 0 24), that form the bulk of the peak of significant results in the above example are respectively 0.2, 0.6 and 0.4, i.e. considerably below the currently recommended limits on the validity of the K. Pearson chi squared test. The lower curves of Fig. 6 show the effect of policies of limiting the K. Pearson chi squared test to tables where all expected numbers are above 1, 2, and 3, respectively, with the tables that do not meet these limits being judged non-significant due to small numbers. Even the limitation of a minimum expected number of 1 is enough to abolish the peak, and achieve a performance closer to the ideal.
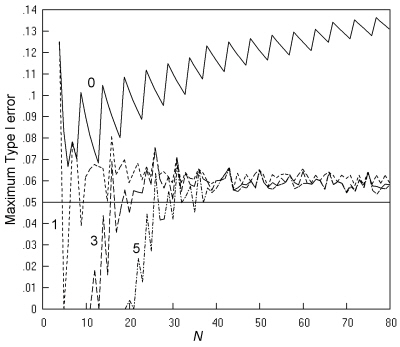
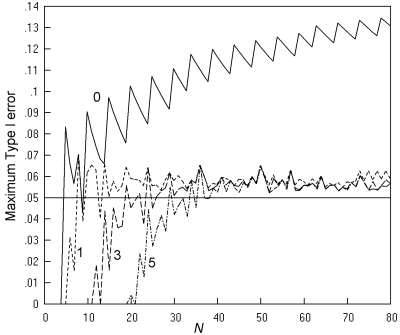
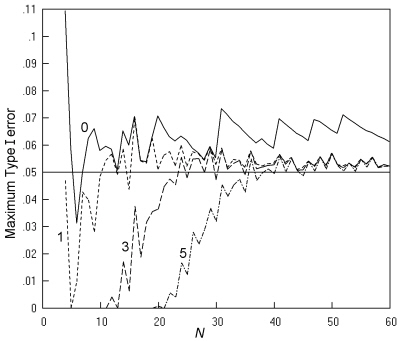
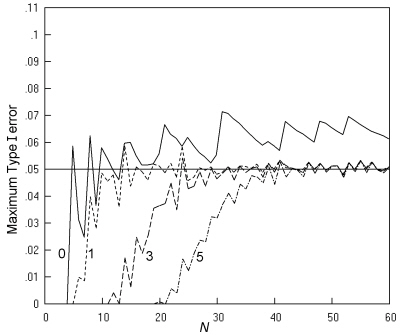
Whether this is a general effect (at all m, n combinations, and at all N) is investigated in Fig. 7. This compares Type I errors for four policies, restricting the K. Pearson chi squared test to tables with expected numbers of at least 0, 1, 3 and 5 respectively. The top line shows no limitation and so repeats the corresponding line in Fig. 5. The bottom line shows the effect of restricting use of the test to tables where all expected numbers are at least 5, i.e. to Cochran's much quoted recommendations. This last restriction is effective in abolishing the excessively high values of Type I errors, so that the maximum rate lies between 0.05 and 0.06 for most values of N greater than 25.
Coloured version
Fig. 7. Comparative trials analysed by K. Pearson's chi squared test: The maximum Type I error at a nominal α of 0.05 is shown when there is no restriction (----) , and when the test is restricted to sample tables with expected numbers of at least 1 (- - -), 3 (-- --), or 5 (-- - --), with an inaccuracy of less than 0.001.
Fig. 8 gives more detail by showing the maximum Type I error across all values of π for all the individual m, n pairs at each N (not just for the m, n pair giving the largest value) where the limitation is to expected numbers greater than 5. Most of the maximum error rates lie between 0.04 and 0.06, with just a small number above 0.6. Returning to Fig. 7, the middle two lines (showing maximum Type I error rates for the limitation on sample tables to those with the expected numbers to at least 1 and at least 3, respectively) show that there is limited scope for relaxing the limit of 5, since the maximum Type I error rate has many peaks above 0.06, which would seem unacceptable.
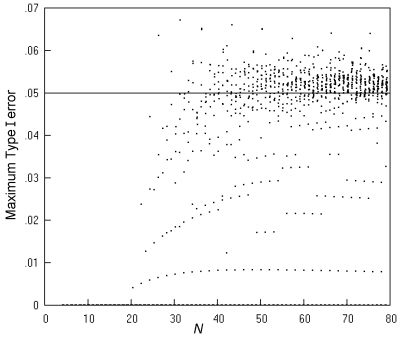
Fig. 8. Comparative trials analysed by K. Pearson's chi squared test restricted to sample tables with expected numbers of at least 5: the maximum Type I error over all values of π for each possible m, n pair at a nominal α of 0.05, and an inaccuracy of less than 0.001.
Fig. 9 gives a repeat of this analysis for the 'N - 1' chi squared test. The Type I error rates are generally slightly lower than those for the K. Pearson chi squared test, and now, even with a restriction of a minimum expected number of 1, the peak rates are generally in the range of 0.04 to 0.06, even with very small values of N.
Coloured version
Fig. 9. Comparative trials analysed by the 'N - 1' chi squared test: The maximum Type I error at a nominal α of 0.05, and an inaccuracy of less than 0.001. Key as in Fig. 7.
Fig. 10 gives details of the maximum Type I error rates across all values of π for all the individual m, n pairs, when use is limited to tables with a minimum expected number of 1. The scatter is mostly in the range of 0.04 to 0.06 and comparable to that for the K. Pearson chi squared test under the currently widely used Cochran's recommendations (Fig. 8). (The highest value of 0.0703 occurs at N = 8, m = n = 4.)
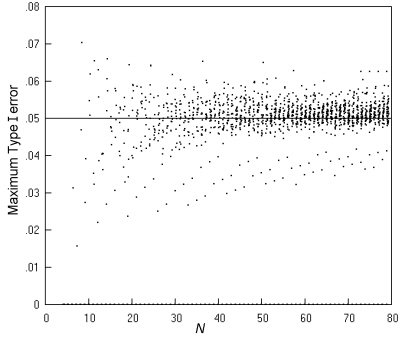
Fig. 10. Comparative trials analysed by the 'N - 1' chi squared test restricted to sample tables with expected numbers of at least 1: the maximum Type I error over all values of π for each possible m, n pair at a nominal α of 0.05, and an inaccuracy of less than 0.001.
Fig. 11 shows a similar analysis for the mid-P Fisher-Irwin test by Irwin's rule. It can be seen that restricting the test to sample tables with particular expected numbers does not produce the desired behaviour of maximum Type I error rates of around 0.05. This analysis was not repeated for the remaining four tests, since they have maximum Type I errors that are in all cases less than 0.06 without restriction of expected cell numbers.
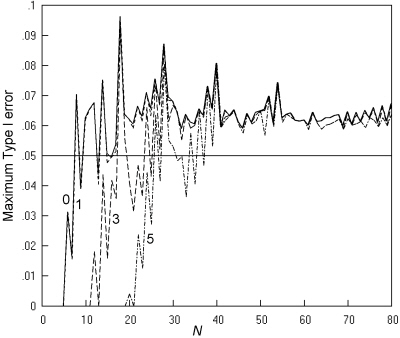
Fig. 11. Comparative trials analysed by the mid-P Fisher-Irwin test by Irwin's rule: The maximum Type I error at a nominal α of 0.05, and an inaccuracy of less than 0.001. Key as in Fig. 7.
These findings at an α of 0.05 also apply to an α of 0.02, 0.01 and 0.1, as can be confirmed by downloading and running the software used. Findings for the maximum Type I error excess are also similar. It is concluded that in the case of comparative trials, the 'N - 1' chi squared test used at a minimum expected number of 1, is preferable to the K. Pearson chi squared test used with a minimum expected number of 5, in having a good match to the nominal level at a wider range of values of N.
Cross-sectional studies
Although computationally more difficult, the results for cross-sectional studies are less complex to present than those for comparative trials because in describing the maximum Type I error across all null hypotheses, the sample size variable is the total sample size, N, rather than all the separate m, n pairings. In general, the findings of this study for cross-sectional studies were a repeat of those for comparative trials. This is not surprising since the frequency of any sample table in a cross-sectional study, when the total sample size is N, is the weighted mean of the frequencies of that table under all the possible m, n pairs that might occur with that value of N, with the weightings being governed by the value of π for the binary row variable. Three tests (the same three as in comparative trials) have maximum Type I errors that can be considerably above the nominal level of 0.05 (Fig. 12), while four tests (the same four as in comparative trials) have Type I error rates considerably below the nominal until N = 30, or more.
Full sized version
Coloured version
Fig. 12. Cross-sectional studies: The maximum Type I error over all values of π1 and π2 at a nominal α of 0.05 for 7 tests, with an inaccuracy of less than 0.001.
Figs. 13, 14 and 15 show, for the three tests with maximum Type I error rates well above the nominal, the effect of policies of limiting the tests to sample tables with particular minimum expected numbers.
Coloured version
Fig. 13. Cross-sectional studies analysed by K. Pearson's chi squared test: The maximum Type I error at a nominal α of 0.05 is shown when there is no restriction (----) and when the test is restricted to sample tables with expected numbers of at least 1 (- - -), 3 (-- --), or 5 (-- - --), with an inaccuracy of less than 0.001.
Coloured version
Fig. 14. Cross-sectional studies analysed by the 'N - 1' chi squared test: The maximum Type I error at a nominal α of 0.05, and an inaccuracy of less than 0.001. Key as in Fig. 13.
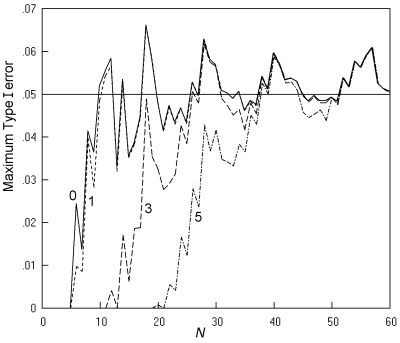
Fig. 15. Cross-sectional studies analysed by the mid-P Fisher-Irwin test by Irwin's rule: The maximum Type I error at a nominal α of 0.05, and an inaccuracy of less than 0.001. Key as in Fig. 13.
When limited to tables with a minimum expected number of 1, both the K. Pearson and the 'N - 1' chi squared tests give maximum Type I error rates of no more than 0.06, except for the K. Pearson chi squared test at two values of N (16 and 19). With this limitation, both these tests give Type I error rates closer to the nominal than the mid-P Fisher-Irwin test by Irwin's rule under any limitation of the minimum expected number (Fig. 15).
The results for the maximum Type I error excess favour the 'N - 1' chi squared test restricted to tables with a minimum expected number of 1 over the K. Pearson chi squared test with the same restriction, since the maximum Type I error excess by K. Pearson's chi squared test for nominal significance levels up to 0.05 is in many cases in the range of 0.010 to 0.020 (Fig. 16), contravening Cochran's criterion, while for the 'N - 1' chi squared test, the largest excess is 0.010 (Figure not shown). The results at an α of 0.02 similarly gave a satisfactory performance for the 'N - 1' chi squared test restricted to tables with a minimum expected number of 1, but excessively high values of the maximum Type I error excess for the K. Pearson chi squared test with the same limitation. Results at an α of (up to) 0.01 and 0.1 also showed satisfactory performance for the 'N - 1' chi squared test restricted to tables with a minimum expected number of 1 in terms of both maximum Type I error and maximum Type I error excess.
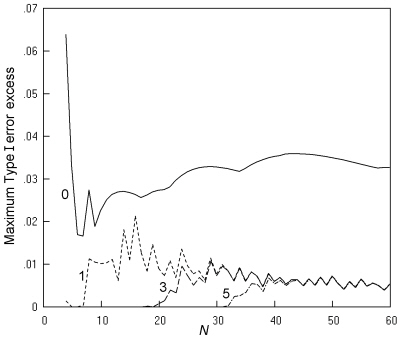
Fig. 16. Cross-sectional studies analysed by K. Pearson's chi squared test: The maximum Type I error excess is shown for nominal values up to 0.05, with an inaccuracy of less than 0.001. Key as in Fig. 13.
Figures 9 and 14 show that the 'N - 1' chi squared test, when restricted to tables with all expected numbers of at least 1, gives a good match between the maximum Type I error (across all values of π, or π1 and π2) at a nominal value of 0.05. This good performance is not limited to the maximum Type I error. For example, in cross-sectional studies at a nominal value of 0.05, the Type I error is generally at least 0.04 for central' pairs of values of π1 and π2 (e.g. π1 > 0.3 and π2 > 0.3) for N of 14 or more.
Power and ordering of the sample space
Of the seven tests whose Type I errors were studied (above), six were compared in terms of the number of different sample tables in a cross-sectional study that are significant at 5%. The mid-P Fisher-Irwin test by Irwin's rule was excluded from this comparison because of the findings above that it is invalid through high Type I errors, and because it cannot be made valid by restriction to particular sample tables via imposing a minimum expected number. As an example of the six tests studied, the findings for N = 40 are shown in Table 5. This shows the number of sample tables significant by each test at 5%, counting tables that are similar by symmetry as distinct.
Table 5. Comparison of tests in a cross-sectional study of size 40. Number of sample tables significant by each test at 5%. There are a total of 12341 different sample tables.
| ____________________________________________________________________ | |
| Test | Number of significant sample tables |
| ____________________________________________________________________ | |
| K. Pearson chi squared test | 6106 |
| 'N - 1' chi squared test | 6054 |
| Mid-P Fisher-Irwin test, by doubling one-sided | 5634 |
| Fisher-Irwin test, by Irwin's rule | 5414 |
| Yates's chi squared test | 4974 |
| Fisher-Irwin test, by doubling one-sided | 4946 |
| ____________________________________________________________________ | |
In fact, for each value of N investigated, i.e. for all integers from 4 to 80, the numbers of significant sample tables lie in the same order as in Table 5, except that the order of the last two tests is in some cases reversed. Furthermore, for all N up to 43, the sets of tables significant by the bottom four tests in Table 5 were each a subset of the set of tables significant by the 'N - 1' chi squared test (which was a subset of the set of tables significant by the K. Pearson chi squared test). From this, it can be concluded that the higher Type I errors of the K. Pearson chi squared test do translate into higher power for all alternative hypotheses, and similarly that the second most powerful test is the 'N - 1' chi squared test for all alternative hypotheses, for all N up to 43. Beyond N = 43, the situation becomes more complex, and in some cases, there are a relatively small number of sample tables that are significant by one of the lower tests in Table 5, that are not significant by the top two. However, it seems likely that they remain the most powerful tests for most, if not all, alternatives hypotheses.
Summary of results and consideration of test policies
The results presented here (and other results) show that a valid approach to the analysis of 2 x 2 tables arising from comparative trials is by K. Pearson's chi squared test limited to tables where the minimum expected number is at least 5 (it is valid in the sense that the Type I errors do not appreciably exceed the nominal for any null hypothesis). The results also show that a better test is the 'N - 1' chi squared test, used when the minimum expected number is at least 1, since it is also valid, but is applicable to smaller sample sizes. The mid-P Fisher-Irwin test by Irwin's rule was found to be invalid through having Type I error rates that are too far above the nominal, a behaviour that cannot be prevented by a restriction to tables with particular expected numbers. The remaining four tests (Yates's chi squared test and the other versions of the Fisher-Irwin test) all have relatively low Type I error rates at small sample sizes, and are less powerful than the 'N - 1' chi squared test. For 2 x 2 tables arising from cross-sectional studies, similar results were found.
So far, it has been individual tests that have been compared, with perhaps some restriction according to minimum expected numbers. However, in the real world, current practice is generally for investigators to use two different tests for 2 x 2 tables depending on the smallest expected number, typically using a version of the chi squared test where all expected numbers are above 5, and a version of the Fisher-Irwin test otherwise. The results presented here establish the superiority of the 'N - 1' chi squared test provided it is restricted to tables where all expected numbers are at least 1. What should be done in those cases where the smallest expected number is less than 1? It seems reasonable to perform an analysis by a version of the Fisher-Irwin test, and the Fisher-Irwin test by Irwin's rule has the advantages of being well known, and of having Type I errors closer to the nominal than the Fisher-Irwin test by doubling the one-sided value (the mid-P Fisher-Irwin test by doubling the one-sided value has slightly higher Type I errors, but is much less well known). So we can formulate a test policy of analysis by the 'N - 1' chi squared test when all expected numbers are at least 1, and otherwise by the Fisher-Irwin test by Irwin's rule. This test policy would then be more powerful than Yates's chi squared test, the standard Fisher-Irwin tests, and the mid-P Fisher-Irwin test doubling the one-sided value, when used alone. It is necessary to check that performing the Fisher-Irwin test by Irwin's rule when the minimum expected number is less than 1 (in addition to the 'N - 1' chi squared test in tables where expected numbers are all at least 1) does not result in an increase in the Type I error to an unacceptable level. Further calculations in this study showed that for both comparative trials and cross-sectional studies, there are only small increases in the maximum Type I error over all population proportion(s) at an α of 0.05. The most relevant increase in the maximum type I error is of 0.0003 in a comparative trial when N = 22, giving an increase in the maximum Type I error from 0.0583 to 0.0586. Other increases are smaller, or affect maximum Type I errors that are less than the nominal. (This does not mean that there are no appreciable improvements in low Type I errors at particular values of the population proportion(s) - the point is that the maximum Type I error is never increased by an amount sufficient to make the test policy invalid.)
Back to top